Fermentation
All the magic that happens from the end of brewday onwards. Logging and recording your gravity and temperature.
The fermentation section is where you add all your readings - during brewday, and afterwards. You'll mostly be using this to record your gravity as your beer goes through fermentation.
In order to understand what your beer is doing - how the mash has performed, how the yeast is getting on, you need to record a bit of information. You'll need to take:
- Gravity and volume readings with a refractometer (and whatever you measure volume with) during brewday. You have the option to record brewday temperatures in the readings, but you don't really need them.
- Temperature and Gravity readings with a hydrometer after brewday. You can use a refractometer for gravity readings, and our calculator should make a best attempt at getting this right, but the hydrometer is probably more accurate.
There are a variety of charts and graphs here to help you better visualise what's going on.
Options / Buttons
Calculations
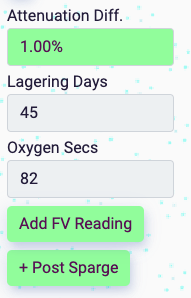
Here you can see several calculated figures:
- Attenuation Difference: the percentage difference between predicted attenuation and measured attenuation. If you've not entered any readings, this will show up as 0.
- Red = Over Attenuated: you may have some sort of infection, or have mashed too long.
- Blue = Under Attenuated: fermentation has either stalled or not finished yet. Be very careful before bottling your beer!
- Lagering Days: according to the gravity of the beer, how many days should it be lagered (if wished).
- Oxygen Secs: how many seconds to pump oxygen through the wort to aerate it.
Buttons
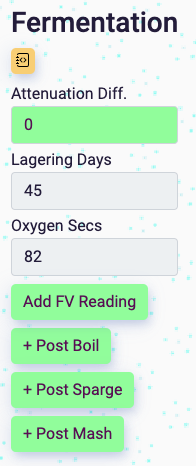
If you've not entered any temperature or gravity readings, you'll have 4 buttons. They're in order of last to first during the brewing process:
- Add FV Reading: add a temperature and/or gravity reading throughout fermentation. Accurate figures here at the beginning and end of fermentation will give you correct measured ABV/attenuation amounts. NB FV = Fermentation Vessel
- + Post Boil: reading after boil has finished.
- + Post Sparge: reading after sparging.
- + Post Mash: reading after the mash.
Apart from the FV readings, you're only allowed to enter one of these per recipe. So when you add them, they'll disappear. You can edit the figures on the table once they're added. In the screenshot of the buttons above, the post boil and post mash readings have already been added. In the screenshot of the buttons below, none have been added.
Note: When you add these readings, the system will always try to give you some decent presets for the date, temp, gravity.
Charts
Predicted vs Actual Attenuation
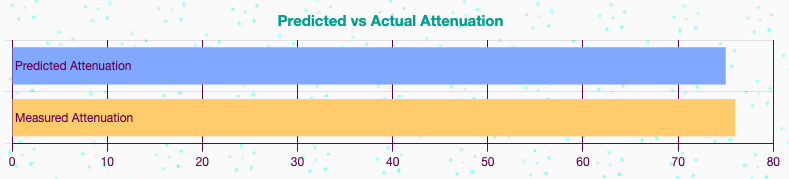
Attenuation is the percentage of sugars that get eaten by the yeast during fermentation.
Predicted attenuation we'll use the specifications from the yeast manufacturer to calculate this once you've added one to the yeast ingredients. If you've added two or more, we'll go with the highest figure. We just take an average between the maximum and minimum attenuation figures.
Measured attenuation is calculated from your oldest and most recent FV gravity readings.
Predicted vs Actual ABV
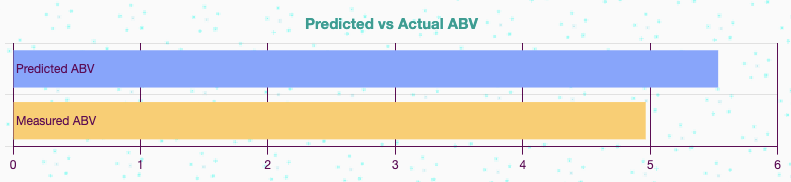
ABV = alcohol by volume.
Predicted ABV we work out by predicting the gravity of your wort into the fermenter, and use the predicted attenuation figures to calculate the ABV.
Measured ABV as with measured attenuation, is calculated from your oldest and most recent FV gravity readings.
Measured vs Predicted Volumes
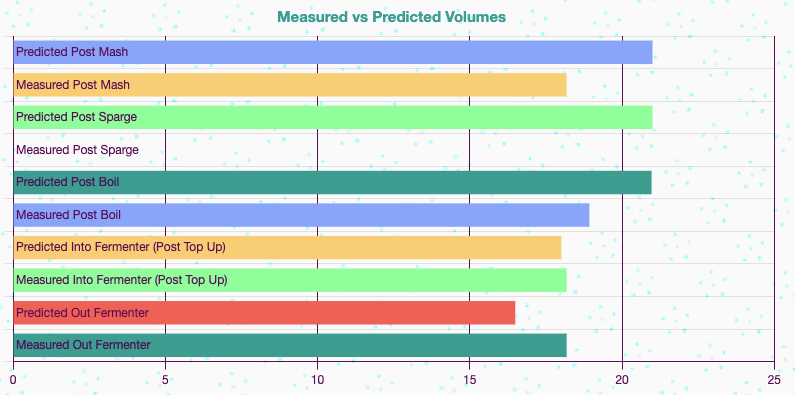
All the predicted volumes in the chart above are based upon various elements:
- Ingredients: water (additions), fermentable (absorb water), hops (absorb water)
- Equipment: deadspace, evaporation, shrinkage
The measured volumes are recorded thus:
- Measured Post Mash: + Post Mash button / Post Mash reading Volume type
- Measured Post Sparge: + Post Sparge button / Post Sparge reading Volume type
- Measured Post Boil: + Post Boil button / Post Boil reading Volume type
- Measured Into Fermenter (Post Top Up): Add FV Reading button / OLDEST Fermenter reading Volume type
- Measured Out Fermenter: Add FV Reading button / MOST RECENT Fermenter reading Volume type
Please note how the measured into/out fermenter readings are recorded. The dates on the readings will determine the figures on the chart.
Readings Table and Chart
Once you click on an add reading button, the readings table will expand into view. You can also click on the Gravity, Temperature and Volume Readings button to open this table up.
Here we have no readings.
![]()
If we add post mash and post boil readings to the table by clicking the + Post Mash and + Post Boil buttons, and entering the correct figures:
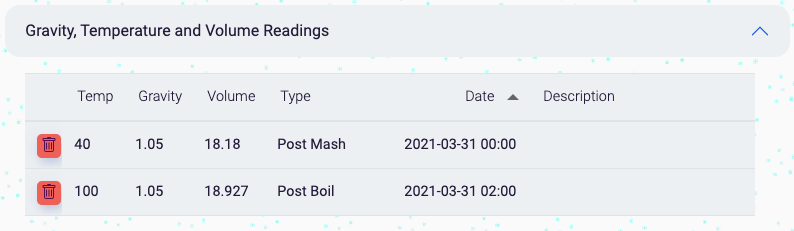
Look, the chart now has your data.
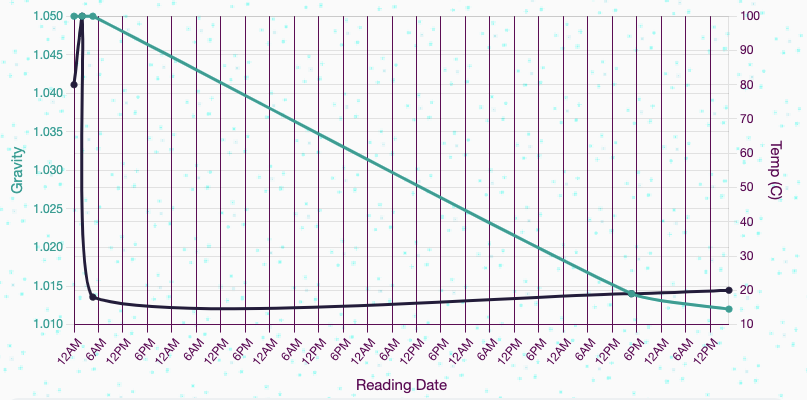
Note the green line and the green text (Gravity) on the left hand side representing gravity. The black line matches with the right hand text (Temp (C)) and shows you the temperature.
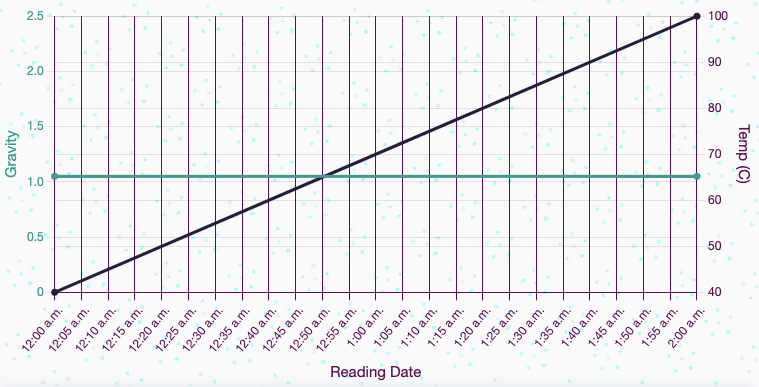
We're not so fussed about brewday temperature though, lets try adding some more readings.
In addition to the post mash and post boil readings, I've added 3 fermenter readings.
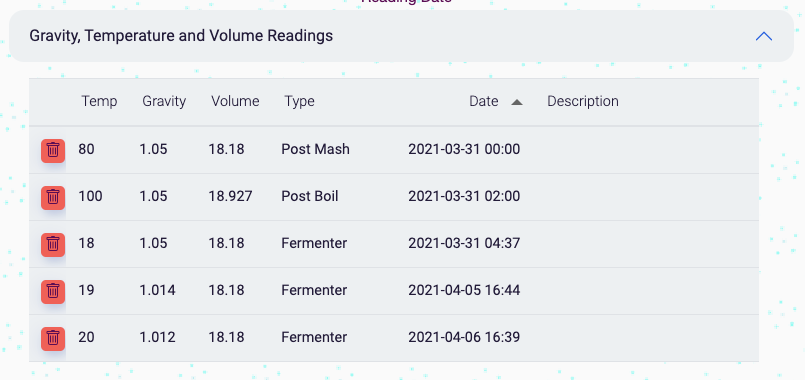
The readings chart will update now with some better visual information to show you about your brew:
todo
- Check whether under/over attenuation figures come from actual yeast data or they're just ballpark figures. Would be nice if they come from the specs on the yeast.
- Create a max/min attenuation line to show the attenuation safety zone.
- Advanced: Plaato/tilt etc data into the DB.
James Torr 18 Jun 22